Sunday, November 29, 2009

Technical Update 46.09

A holiday shortened week and some wild swings toward the end were not enough to move the major indices very far from the unchanged mark. On a weekly basis they closed flat in North America and Europe, although Asian markets finished considerably lower.

The inability of Dubai World to repay its debts is what gets the blame for the late week selloff. But I am more inclined to believe it was simply jumpy speculators, fearful of losing their gains before the end of the year. Whether or not this event proves to be of any longer term importance largely depends on market participants' willingness to see that Dubai is not alone.

In fact, Dubai is a relatively small shoe among those waiting to be dropped. Excessive debt levels are everywhere. In many cases debt levels and leverage are higher than they were prior to the 2008 credit crisis. The only thing that has changed is sentiment. Popular sentiment is that governments will bailout banks that get in too much trouble; that large companies will be assisted in rolling over their debts; that overleveraged companies will be able to "earn" their way out of their problems in a recovering economy; and that increasing debt servicing burdens do not pose as barriers to any of the above.

As soon as perception is changed, the deleveraging of 2008 will continue anew. None of the problems were actually dealt with expediently. They were merely swept under the rug - given "lifelines." But those lifelines expire. So when the sheer mathematics of the situation meet the expiring lifelines that were given in the panic of 2008 and early 2009, the result will be unsurprising. (Abu Dhabi gave a similar "lifeline" to Dubai last year)

Dubai could serve as a stark reminder of this reality. Or it could be again rolled over and swept under the rug for another year. We've seen warning shots like this before. Remember back to June of 2007, when two Bear Stearns hedge funds blew up. This was quickly made to disappear while stocks continued higher for a few more weeks. Then another big shock in August. And again new highs for stocks into October. Thus, I would avoid taking this recent event as the long awaited "catalyst" for a move lower. I would instead watch for signals of contagion in credit markets. Are CDS spreads blowing out on other sovereigns early this week? Greece, Ireland, Spain, Italy, Mexico, Pakistan, Latvia, Saudi Arabia and numerous eastern European nations should be given extra attention this week.

Unless credit contagion is plainly visible early next week, I would be wary of a short covering rally that takes us to immediate new highs. But if nothing else, this recent incident has given us confirmation to the existence of a massive US Dollar carry trade. On Thursday night, the US Dollar spiked higher as speculators got spooked. Nothing else was spared. Gold was down $60. S&P futures were down more than 40 points. Oil dropped $5. And the phenomenon was worldwide.

Considering this is a technical update, I'll post a few charts before closing out.

First up is a chart of sentiment. It is the Investor's Intelligence bull:bear ratio. As you can see, the percentage of bulls relative to bears has reached a new extreme for the rally. This is typically a contrary indicator. (note: numbers are as of Nov 23rd)


Last week, I pointed out that the BKX (Bank Index) was underperforming and was poised to make a large move. It again underperformed this week. Below is an hourly chart of the past 3 months. Below its November lows, things start to get ugly for this index. Signs of credit stress should show themselves in this index first. Falling share prices in the banks will beget talks of more writedowns (not to mention coming accounting changes at end of year). And more writedowns will beget talks of further government assistance. The mere mention of this will absolutely crush improving social mood. And I don't believe further assistance will be politically possible. The big banks remain insolvent. That is the way they will inevitably end up. Attempts to paper over this reality appear to be unravelling.


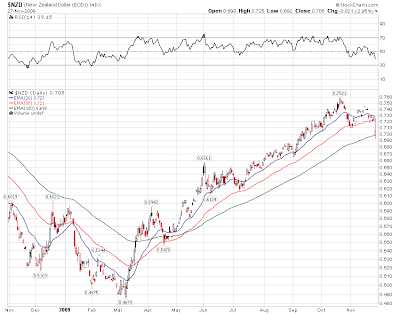
I mentioned the Aussie Dollar last week as a carry currency. It weakened further this week. But the New Zealand dollar, while considerably less liquid, is also one to watch for signs of tense carry traders vacating their positions. It got creamed on Friday and is deserving of some attention in the event of followthrough.


Japanese banks are some of the most susceptible to falling asset prices. And they still have not worked through the bad debts racked up in the 80s. The Japanese Nikkei has been falling while the Yen rises to new highs. This is extremely painful to Japanese exporters and there are serious cracks between the new Japanese government and the central bank. Something could crack here too.


Have a great week!


Disclaimer: The content on this site is provided as general information only and should not be taken as investment advice. All site content, including advertisements, shall not be construed as a recommendation to buy or sell any security or financial instrument, or to participate in any particular trading or investment strategy. The ideas expressed on this site are solely the opinions of the author(s) and do not necessarily represent the opinions of sponsors or firms affiliated with the author(s). The author may or may not have a position in any company or advertiser referenced above. Any action that you take as a result of information, analysis, or advertisement on this site is ultimately your responsibility. Consult your investment adviser before making any investment decisions.

Thursday, November 26, 2009

Canadian Real Estate Goes Wacky

Consider me one of those that never expected the Canadian RE market to rebound after property values began to sink in 2008. But as we have been reminded by numerous bubbles over the years, parabolic blowoffs can last a lot longer than most imagine. Such is the case in Canada's two primary urban markets, Vancouver and Toronto. A concoction of factors has contributed to rapidly rising prices and euphoric expectations about the future.

Of course, when one has messages like the following being printed by newspapers almost daily, it should be no surprise that Canadians have been duped into believing the unbelievable:
“People are re-entering the market – they have the confidence to take advantage of bargain-basement prices. There's been a release of pent-up demand, and that has a long time to play out. Prices have gone as low as they are going to go.”

The above statement came from Gregory Klump, Chief Economist of the Canadian Real Estate Association. Astute readers may equate those statements with those of David Lereah who held the same position with the National Real Estate Association in the US. Lereah later admitted that his analysis was greatly compromised by the position he held - or in not so nice terms, he was a paid shill for the housing industry in the US. Regardless of this unsurprising revelation, the media here in Canada have no problem quoting Gregory Klump as if he were a legitimate expert worth listening to.

But the parallels don't end there for media treatment of the Canadian and American housing bubbles. Time magazine infamously called the top of the real estate market with their magazine cover titled, "Home $weet Home: Why We're Gaga Over Real Estate."


That was June of 2005 - what later was revealed as the top of the national bubble. It continued in some areas thereafter, but the writing was on the wall. In early November, an eerily similar picture arrived on my doorstep in the local Vancouver paper The Georgia Straight.


Intrigued and terrified I proceeded toward page 19, where the feature article lay. Along the way, I was inundated with full page ads for condo developments and just as many for luxury furnishing. The story started out documenting a 24 year old Indo-Canadian pharmacist's experience in buying his first condo. That was fine. But four paragraphs in, journalistic integrity took a back seat to complete fluff. Quoting the pharmacist:
"One of my friends who I used to live with in university, he's like, 'I feel since you bought your place, you've matured. You've completely changed in the way that you are. Before, we used to live the student lifestyle. Now, you're always cleaning your place. You have plants. You look after them. You've even got a cat now. It's like you're an adult.'"

Pass me a bucket. This reminds me of the disgusting marketing tactics used by penis enlargement pill pushers.

But that isn't all. The article goes on, defining the term "puff piece," quoting the most prominent figures in the local real estate market. First up was Cameron McNeill, real estate marketer:

...McNeill, whose company sold more than a billion dollars worth of real estate in the hot housing market of 2007, told the Straight by phone that he thinks the Olympics will keep a spotlight on Vancouver and magnify positive fundamental factors driving demand. According to him, those factors include low interest rates, a shortage of downtown land, good provincial government stewardship of the economy, and a safe investment climate.

McNeill added that it doesn't make sense to compare Vancouver-which has broad international appeal-to other Winter Games host cities. "Who wants to live in Salt Lake City?" he asked. "Lillehammer? I didn't know that town existed until the Olympics happened."

"I think the Olympics creates a euphoria, he stated. "But honestly, I don't think prices are going to spike preceding or post-Olympics significantly. I believe the real benefit of the Olympics is going to come in one, two, three, four years down the road."

Prices rose uncontrollably as soon as the Olympics were announced. It is something that has contributed to Vancouver becoming the most unaffordable city to live in in the Anglosphere with exception of some coastal paradises in northeast Australia (based on price-income ratios). McNeill also speaks of the oft-cited "land shortage." There is no land shortage - not even in downtown Vancouver. Where more square footage is required, we can build skyward, like any other city. There are blocks upon blocks of tired old buildings just waiting to be bulldozed and redeveloped. The map below is downtown Vancouver. Outlined in red is a huge chunk of largely underutilized land. Light industrial warehouses consume most of it. Century old rail yards take up much of the rest. Limited creativity is needed to see how existing land can be converted for other purposes.


Next up was Bob Rennie, another real estate marketer. Naturally, he echoed McNeill's sentiments:
..."It's after the Olympics that we're going to see the impact on real estate." ... "I don't believe that anyone ran back to Turin or Lillehammer or Salt Lake City... to buy a secondary residence or to move the family to safety or to move some money to safety. Vancouver is on the map. We're a world city. We're a brand."

The above statements will come across to most readers as unparalleled in arrogance. In fact, it is common sentiment here in Vancouver. This is best reflected by the Provincial Government's recent change in our provincial slogan from "Beautiful British Columbia" to "British Columbia: The Best Place On Earth." This, along with the above statements from Rennie and McNeill articulate perfectly the peak social mood this city is in. Despite 24 hour rain and eternal darkness for at least 6 months of the year, these folks can't see why anyone would choose to live elsewhere. Completely lost on them is that nearly everybody in the world is somehow passionate about where they are from, just like they are.

Don't get me wrong. Vancouver is a beautiful city. After traveling to over 20 countries in 5 continents, people ask me where my favourite place is. I answer "home." But while the combination of mountains and the ocean is my idea of paradise, I realize it may not be for others. There may be some wealthy visitors coming for the Olympics, but to contend that enough of them are going to want to buy houses to make an appreciable and lasting impact on the market is disingenuous. They will come and spend money. A tiny fraction will actually buy property, something which the market has already priced in.

But the opposite is also liable to occur. A wave of investors that have been holding supply off the market in anticipation of this event could flood the market just before the games, driving prices down and causing panic in those depending on a bonanza. Keep in mind that prices are still down in an 18 month period. This was not in the plans of investors who assumed prices would rise all the way up to the games. Now that this hasn't happened, industry promoters suggest prices will rise after the games.

The article goes on to quote more of these promoters, continually offering only one side of the story. It is never mentioned that even with mortgage rates at all-time lows, most borrowers are spending in excess of 40% of their incomes on minimum mortgage payments. And it is never mentioned that it requires up to 9 times the average household income to purchase a home in many parts of Vancouver (depending on how income is counted). There is only one explanation for statistics like these, many standard deviations from their historical norms. And it is the same explanation almost anytime we see prices divorced from their fundamental values.

Credit Expansion Fuels The Bubble

Like all other bubbles, the major contributing factor to this one is easy credit availability. In order to protect the Canadian manufacturing industry from a rapidly rising currency, the Bank of Canada has recklessly slashed benchmark interest rates to 0.25% and has left them there.

But the real driver of credit expansion can be traced back to the CMHC - the Canadian Mortgage and Housing Corporation. This is a government owned corporation which offers mortgage insurance and buys securitized mortgages in order to keep interest rates low and allow more Canadians to "afford" a home. From the CMHC's website:
CMHC plays a significant role in sustaining a healthy housing market and supporting access to low-cost mortgage financing. Generations of first time homebuyers who have limited down payments have been able to obtain mortgages at rates comparable to those with higher down payments due to our mortgage loan insurance products.

This has been the great enabler. And very much like their cousins Fannie, Freddie and the FHA down south, their very existence serves to accomplish precisely the opposite of what they intend - to make homeownership more affordable. They artificially stimulate demand, pushing up prices in the process. This fuels the notion that prices always rise, causing fearful prospective buyers to make poor economic decisions.

A revealing article was brought to my attention that confirms what we already knew. The CMHC along with the Conservative government were fueling a bubble in order to prevent the housing market from correcting to its natural level. More than $100 Billion in mortgages had already been guaranteed by the federal government, guarantees that would quickly turn into losses should prices fall considerably. Naturally, the solution was to make the problem even bigger. Guarantee even more mortgages, fix prices higher, and hope it all blows over. Murray Dobbin writes:
The facts are that over 90 per cent of existing mortgages in Canada are “securitized” -- that’s the practice of pooling mortgages (or other assets) and then issuing new securities backed by the pool -- MBSs, or Mortgage Backed Securities. That’s what happened with the sub-prime mortgages in the U.S. which (because the whole pool was so diversified) received triple A ratings by the rating agencies. Losses around the world amounted to hundred of billions of dollars.

Credit is still tight in the U.S. because no private investor has the stomach for such risky MBSs. That’s because those losses were private and not back-stopped by any government. In Canada, mortgages have been securitized for years. The Canadian-issued securitizations are called National Housing Act, Mortgage-Backed Securities. Unlike the failed U.S. pools, says Lepoidevin, “In order to find buyers for securitized mortgage pools, the Government of Canada has put guarantees on them” by directing CMHC to guarantee all Canadian mortgages.
...
By the end of 2007 there were $138 billion in NHA securitized pools outstanding and guaranteed by CMHC -- 17.8 per cent of all outstanding mortgages. By June 30, 2009, that figure was $290 billion, a figure Lepoidevin says “…exceeds the total value of mortgages offered by CMHC in its 57 years of existence!” CMHC’s stated goal was to guarantee $340 billion by the end of this year and is on track to reach $500 billion by the end of 2010. Total mortgage credit in Canada will grow by 12-14 per cent of GDP in 2009.

In an effort to prop up the real estate market in 2008 (when affordability nosedived) the Harper government directed the CMHC to approve as many high-risk borrowers as possible and to keep credit flowing. CMHC described these risky loans as “…high ratio homeowner units approved to address less-served markets and/or to serve specific government priorities.” The approval rate for these risky loans went from 33 per cent in 2007 to 42 per cent in 2008. By mid-2007 average equity as a share of home value was down to 6 per cent -- from 48 per cent in 2003. At the peak of the U.S. housing bubble, just before it burst, house prices were five times the average American income; in Canada today that ratio is 7.4:1 almost 50 per cent higher.

This high-risk policy actually prevents the natural playing out of the recession -- that is, the purging of the excesses of the previous boom period. CMHC’s easy-money resulted in a 9.3 per cent increase in Canadian household debt between June 2008 and June 2009.

Even bank economists admit to being concerned about a housing bubble. In a September research note, Scotiabank economists Derek Holt and Karen Cordes said, “…lenders have been scrambling to get enough product to put into the federal government’s Insured Mortgage Purchase Program over the months, and that may have translated into excessively generous financing terms.” Holt suggested that in two or three years -- or whenever the Bank of Canada increases interest rates -- many of these mortgages would be at risk.

The banks themselves have taken on virtually no new risk. According to CMHC numbers in the two years from the beginning of 2007 to January 2009 Canadian banks increased their total mortgage credit outstanding by only 0.01 per cent. Fully 90.5 per cent of all growth in total Canadian mortgage credit outstanding since 2007 has been accounted for by Mortgage Backed Securities. Of course, the banks have no interest in saying no if you have qualified for a securitized CMHC loan -- because they bear no risk if you default.

If that sounds like sub-prime mortgages, it should. Sub prime is any loan below prime. If a bank refuses you a loan, and CMHC gives you one, the loan is sub-prime. As Lepoidevin says in his warning letter, “Every single U.S. lender specializing in sub-prime has gone bankrupt. The largest sub-prime lender in the world is now the Canadian government.”

Hundreds of billions in government backed guarantees are driving prices to unsustainable levels in Canada. Like all other interventions into the market process, this too will fail. Instead of being on the hook for manageable losses, realizing that mistake and doing away with the CMHC, Prime Minister Harper and Finance Minister Flaherty have tripled the size of the problem, making its inevitable failure as systemically dangerous for Canada's financial system.

Unsubstantiated claims by industry hucksters of "pent-up demand" and foreigner buying sprees suggest prices will forever rise into the sunset. Common sense and a little bit of digging indicate otherwise.


Disclaimer: The content on this site is provided as general information only and should not be taken as investment advice. All site content, including advertisements, shall not be construed as a recommendation to buy or sell any security or financial instrument, or to participate in any particular trading or investment strategy. The ideas expressed on this site are solely the opinions of the author(s) and do not necessarily represent the opinions of sponsors or firms affiliated with the author(s). The author may or may not have a position in any company or advertiser referenced above. Any action that you take as a result of information, analysis, or advertisement on this site is ultimately your responsibility. Consult your investment adviser before making any investment decisions.

Saturday, November 21, 2009

Technical Update 45.09

The S&P 500 is up a little over 7% since early August. It certainly feels like more. The last 4.5 months have been trying for market bears, sucking out volatility premium and refusing to respond to typical measures of extreme market sentiment. The major indices have again reached a point where they can capitalize on the visibly "weak hands" that are propping up the advance.

Judging from the sentiment on the various "bear blogs" I visit, it seems that most are now unconvinced that a top has been reached. These same venues were all quick to jump on previous declines and tops were called confidently. Now, however, with five distinct selloffs that ultimately failed, bears are more apprehensive. This is typical behaviour and indicative of the market taking the "path of maximum frustration." It seems that it is systematically trying to stretch and squeeze bears as much as possible, making as many as possible insolvent in the process.

But despite the seeming lack of conviction among the bearish camp, progressively more and more evidence is piling up in their favour. Every subsequent leg of this advance has been weaker than the previous and the most recent 3 day decline holds even more potential than was evident in mid-October. See the S&P 500 chart below with the VIX (volatility index) overlaid. It has registered a positive divergence relative to the index. RSI and MACD have each registered progressively weaker readings. And we can also see that volume has steadily declined throughout the course of the decline. These are all classic signals of a bear market rally losing steam.


Also of importance is the non confirmation among secondary indices. The Dow, S&P, Nasdaq, FTSE and Wilshire 5000 have each exceeded their October highs. Every other major index has failed to do so. As I wrote two weeks ago:

Tops are a process, while bottoms are an event. And this topping process appears to be no different. Especially bearish would be for certain indices (like the Dow) to make a marginal new high early next week, while the others fail to confirm. The bearish divergences noted in these pages two weeks ago would become even more pronounced.

This is exactly what has happened. So the appropriate stance would be to become MORE bearish given these developments. But that is not the way sentiment typically works. The emotional "pain" that one experiences being proven repeatedly wrong disables the ability to view market action for what it is. The same was true for bottom callers throughout 2008. By the time they were vindicated, few had the conviction to capitalize.

Below is the banking index. The academic consensus is that banks have recovered immensely since the panic lows of last winter. Naturally, they should be making immense profits with their interest spreads the way they are. But share price action tells a different story. They have been the weakest sector since the early spring rally, and the weakest sector over the past month. Could the market be telling us something different via the underperformance in this key sector? Could the balance sheet issues I have been raising for years continue to weigh on share prices? Or worse, is it possible that as many have alluded to continuously that most if not all of the world's major financial institutions are technically insolvent?

Do note the convergence of the moving averages on the chart below. Typically, when this occurs, a large move in one direction or another is imminent.


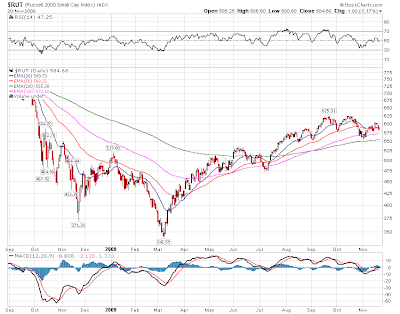
The terrible performance of small cap stocks should be worrying for bulls. In a healthy advance, small caps typically outperform larger cap stocks as smaller companies are more leveraged to prospects of future growth. With big cap names like IBM, MCD and JNJ leading the way with small companies lagging way behind, the hesitancy of bulls in this recent rally becomes easily apparent. Big name money managers have been distributing their shares of small companies to retail holders while they accumulate shares of safer names. We've seen this game before, and we know how it ends.


This can also be illustrated by the relatively few stocks that made new 52 week highs in November compared to those that did in October. Plotted on the chart below and smoothed as a 10 day moving average, the weakness be seen clear as day.


On the currency front, we see similar divergences. The Canadian dollar has backtested its rising trendline and turned back down. This is textbook Elliott Wave behaviour, with the break of the trendline being wave 1 and the retest of the underside being a wave two. So long as the trendline is not regained, the bearish case remains intact.


A similar case can be made for other currencies that have benefited the most from the US Dollar Carry Trade. Most notably the Aussie and Kiwi Dollars, the Brazilian Real and to a lesser extent the Euro. They are all in rather precarious positions, and a technical breach of very obvious support levels will most likely illicit further selling and an unwinding of these speculative positions.

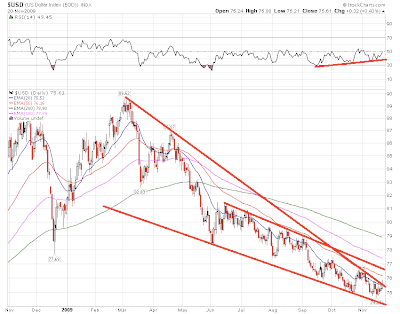
But all of these currencies are moving inversely to the US Dollar Index - whether they are part of the index or not. So it is the big kahuna. And when it breaks above, we can be assured that the rest will break below in sympathy. Below is a chart of the US Dollar. Most notable is the trendline dating back to early March. It has been briefly exceeded twice this month (Nov 3rd and last Friday) but failed to close past that mark. Also of note is a parallel trend channel dating back to June. The upper band of this channel correlates roughly with that Nov 3rd high, giving us a fairly good idea of where resistance resides. 76.81 is the number to beat. If we get two consecutive closes above that number, I'd have a high degree of confidence to call the bottom for the dollar. A spectacular advance would be the result.


That's all for now.

Disclaimer: The content on this site is provided as general information only and should not be taken as investment advice. All site content, including advertisements, shall not be construed as a recommendation to buy or sell any security or financial instrument, or to participate in any particular trading or investment strategy. The ideas expressed on this site are solely the opinions of the author(s) and do not necessarily represent the opinions of sponsors or firms affiliated with the author(s). The author may or may not have a position in any company or advertiser referenced above. Any action that you take as a result of information, analysis, or advertisement on this site is ultimately your responsibility. Consult your investment adviser before making any investment decisions.

Friday, November 20, 2009

Steve Keen Speech

Steve Keen, the Australian economist, gave a brilliant 30 minute speech last week that can be watched in its entirety below.

We are in agreement that debt levels have likely peaked relative to economic activity and that the likely course forward is an unwinding of this debt back to historical norms. I discussed this at length in my last post, "Missing the Forest for the Trees."

edit: the embedded video led to a repetitiously agonizing 16 second trailer for Michael Moore's "Capitalism: A Love Story." The actual speech can be found at the following link:

Full Speech Here

Although Professor Keen and I would likely agree on more than we would disagree, I have doubts that he would endorse the solutions I proposed in that post. He does not believe, it seems, in the benefits of mutual voluntary exchange, instead electing to cling to the absurd Marxist notion of 'capitalist exploitation' over susceptibly 'irrational' actors. To this extent, he is dead wrong. Keen fails to understand the difference between the neoclassical "rational expectations" thesis (that underpins the EMH) and the more Austrian "rational action." Rational expectations, we would agree, are impossible. To be able to foresee exactly how any action will result, one must operate with perfect information, or in other words, omniscience. This is absurd. No individual or group of individuals can make a claim to this ability - government central planners especially. But rational action is something else completely.

Rational action implies that at the time of decision making the actor will always elect something that he/she believes to be beneficial. Otherwise, no action would be taken. For example, if I were sitting on my couch feeling hungry, I may find the idea of expending energy and money to walk around the corner for a hamburger. Upon my completion of this task, whether I found the result of my action satisfying or not, my thought process was rational. It could have been insufficient and given me a tummy ache. I would then have experienced loss on this transaction. But my action was still rational. Rational action can lead to either profit or loss - two necessary potential outcomes for any action.

It seems that modern economics has been consumed by a utopian desire to eliminate "loss" from the realm of possible outcomes in voluntary exchange. To do this, the central planners seek to minimize our ability to engage in voluntary exchange, making more and more exchange involuntary. The justification for this is that people suffer from irrationality and require decisions to be made for them.

No greater folly has poisoned the minds of humankind.


Disclaimer: The content on this site is provided as general information only and should not be taken as investment advice. All site content, including advertisements, shall not be construed as a recommendation to buy or sell any security or financial instrument, or to participate in any particular trading or investment strategy. The ideas expressed on this site are solely the opinions of the author(s) and do not necessarily represent the opinions of sponsors or firms affiliated with the author(s). The author may or may not have a position in any company or advertiser referenced above. Any action that you take as a result of information, analysis, or advertisement on this site is ultimately your responsibility. Consult your investment adviser before making any investment decisions.

Wednesday, November 18, 2009

Missing The Forest For The Trees

With the 65% rally in stock indices, the idea of actual reform of the financial system seems to have been put aside from serious consideration. Law and policy makers are instead holding out in hopes that 2008 was all just a bad dream, a rogue wave that nobody could have expected, or some sort of other metaphorical platitude designed to distract us from the reality of what happened.

Senator Chris Dodd introduced a bill that supposedly will reign in the financial industry. The bill would have been worth reading, and perhaps even worthy of taking seriously were it not over 1100 pages long. The length of the bill tells me everything I need to know - it is filled with loopholes, concessions, and incentives to ensure that any meaningful change can be interpreted away by the best cunning team of lawyers freshly printed money can buy.

Karl Denninger has a pretty good takedown of the bill. That's not to say it's all bad. But the instances of actual reform (like eliminating regulatory arbitrage) will be outweighed by the damage inflicted by the perception of stability being falsely instilled in the minds of all market participants (ie. everyone). This is the single biggest problem I have with regulation. Lawmakers dance around pronouncing how safe and secure everything is, typically exaggerating such stability to make themselves look better, and people take their word (even if they know otherwise), knowing that it is someone else's ass on the line should all go awry. "Moral Hazard" in other words.

Ron Paul's "Audit the Fed" bill (HR 1207) is also under attack from partisans of the status quo. Mel Watt, a congressman from Bank of America's district, has put forward an amendment to the bill that essentially kills it dead. In politics, apparently you don't have to vote against anything. You simply water down what you don't like to the point of making it meaningless. This way you end up with thousands of pages of laws that cancel each other out, confusing everybody except the aforementioned lawyers who's jobs rely on said confusion. Somehow I don't think this is what was in the minds of those who crafted our systems of government, but I digress.

The point is, despite all sorts of cage rattling, nothing is actually being done. And there is mounting evidence that the opposite is happening: the institutions primarily responsible for the crisis have been given the keys to the city with the hopes that they rescue the system on their own accord. Good luck with that.

But as I implied earlier, doing nothing would be a better outcome than creating the perception of doing something while in fact doing nothing. That way, at least people would remain skeptical of the entire framework and reject its further expansion, thus reducing the potential damage.

But can we really expect anything that will actually have a stabilizing effect to be done given that almost nobody understands what caused the crisis in the first place? Obviously not. If you start with faulty assumptions, your analysis is bound to have faulty conclusions. Right now the assumptions are that:

- Banks were always well capitalized - it was just a lack of confidence that put them in jeopardy - and now that confidence is restored, everything will be fine.
- The lack of confidence caused people to save money - thus dampening consumption from its "normal levels" - and with enough "stimulus" there will be a disincentive to save, spurring consumption and helping boost GDP
- There was not enough regulation - new derivatives and bank activities managed to circumvent existing regulations - and with bigger or newer regulations these activities will be brought under control
- Pay incentives for financial executives encouraged unnecessary risk taking - changing the incentive structures for executives will help eliminate excessive risk
- The lack of a resolution authority was the reason why more big banks did not fail - the creation of such an authority will ensure systemic risk is limited
- The present financial system serves a social purpose by providing access to credit which encourages growth and prosperity

All of these assumptions are false. And there are many others. The decisions being made now are based on these assumptions, and therefore their chance of success remains zero. Just as the avoidance of crisis was in 2007.

What are the real problems?

The problems noted above and their accompanying "solutions" have one thing in common: they disregard debt (credit) as any sort of problem. This should come as no surprise, because those who put forward their interpretation of the issues and those who seek to legislate solutions to them nearly all subscribe to economic ideologies that dismiss credit growth as potentially destabilizing for an economy.

But credit growth is the central problem. And the inability for credit to grow further is what caused the crisis. Again, this was a mathematical certainty to occur at some point. One needs only a calculator and 6th grade math to reach that conclusion. When credit growth is compounded at annual rates between 6-15%, it does not take long for the parabolic advance to reach a breaking point. We reached that breaking point when our debt servicing to income ratio began to rise faster than our incomes and the equity in our primary assets (homes). Credit expansion slowed and asset prices, which had already priced-in years of future credit expansion began to be re-priced to levels more in line with our incomes.

Credit is the central cause of the crisis - the disease (if we are to characteristically resort to medical metaphors). The symptoms of the disease are many, a few of which are listed above. By addressing the symptoms we will not reach a paradigm of increased stability over the current system. It will be inherently unstable. Such has been the case for a century. And something that post-Keynesians like Hyman Minsky and many Austrian economists have been arguing for about as long. The only question revolves around what the "redline" is. What level of debt can be sustained by an economy? Of course, this depends on many factors: interest rates, income growth, productivity, etc. Because it is unknown at what level of debt an economy begins to "choke," we cannot say with 100% certainty that it has been reached. But we can make an educated guess, based on the events of last year, that we crossed that level.

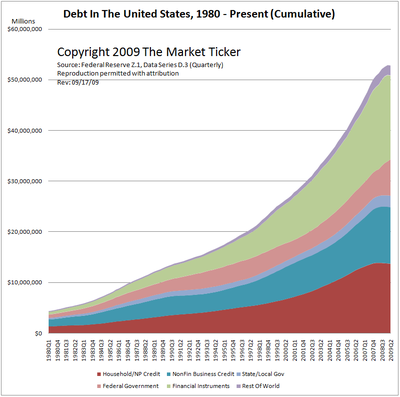
Below is a chart of total public and private debt outstanding in the US. As you can see, total debt is now 4x the size of the entire economy - far more if one factors in unfunded future obligations or if one considers the guarantees issued for suspect financial instruments. (chart courtesy Market Ticker).


Economy bulls believe one of two things:
(1) Debt doesn't matter and this could continue rising for decades, or
(2) We can grow our way out of the problem via productivity advancements and income growth (I'm still yet to find anyone that feels this to be likely).

I have my eyes and ears peeled for any signs of (2), but I just don't see the necessary actions taking place to allow for this (deployment of savings on CapEx by businesses, competitive wages, proper demographic influences, etc). To the contrary. This economic "rebound" is not being led by productive deployments of capital, rather asset price speculation. This is the same reason that led me to believe that the '03-'07 expansion was mostly illegitimate. I was correct then, and I have no reason to believe my analysis was wrong and I just got lucky. The crash in asset values and seizure in credit that I hypothesized would be the result of an illegitimate expansion, happened - only more violently than I thought likely.

As I mentioned above, (1) is false and rooted in fallacious economic theory (Keynesian and Monetarist). While I suppose a temporary expansion of debt levels is possible (so long as interest rates remain low or continue falling, debt servicing ratios don't rise much), my intuition is that the max level was reached in 2008 and there will be neither demand nor supply of credit to allow for further expansion.

The combined factors above lead me to believe that we are on the cusp of another credit seizure and collapse in asset prices for the same reasons it happened last time. Such a collapse is unavoidable. The solution is to let it happen in an orderly fashion, in accordance with the law, and most importantly, with a viable framework for what a replacement financial system will look like once the unwinding is complete.

Discussion on what this system should look like need to begin immediately. If it is not in place prior to the unwinding of the current system, the unwinding runs the risk of being disorderly and vulnerable to being accompanied by the nasty side effects of such a disorderly collapse (ie. starvation, rioting, lawlessness, war, etc).

Simple Proposal For A Sound Financial System

Primarily, it needs to be acknowledged that unbacked credit expansion serves only the needs of a select few (the issuers) at the expense of everyone else. A future system shall make the extension of said unbacked credit a criminal offense. No new laws are required for this. Most western judicial systems have laws against counterfeiting, misappropriation and misrepresentation. As they are written, they need only be applied to the financial system as they are to any other person or industry. Lending anything that one doesn't already possess is a violation of all three laws.

With this one simple interpretive adjustment in the application of our current laws, we can eliminate nearly every adverse symptom of our modern day economies (failure is not an adverse symptom, thus cannot be eliminated). In order to facilitate the above and to structre our financial system in a manner consistent with the law, the following would also prove necessary:

1) Convert all credit obligations for common equity
2) Liquidate the remaining debts that are not backed by existing equity
3) Eliminate legal tender laws
4) Financial institutions will elect to become one of three types of institutions:
i) Depository Institutions - The banks take deposits for safekeeping of a predetermined measure of deposit (dollars, gold, oil, wheat, land, whatever is accepted by the market) and facilitate electronic or physical transactions between like institutions. A fee is charged to depositors for these services.
ii) Lending Intermediaries - These institutions facilitate the matching of lenders and borrowers. A rate of exchange is settled by the two parties at the prevailing market rate. Should the borrower default, the lender experiences loss. The intermediary is responsible for the collection of regular payments and collateral in the event of default. A fee is charged for these services. No risk is ever taken by the intermediary.
iii) Investment Firms - These firms pool capital on behalf of willing investors and use it to speculate or invest on whatever they choose. Returns are based on entrepreneurial intelligence rather than who can take the most risk with borrowed money.
5) Eliminate regulatory redundancies (eg. capital ratios)

There is no social benefit in large, multi-purpose, ultra-leveraged financial institutions. Economies of scale in banking are typically left at municipal lines. Furthermore, our relatively new means of electronic transactions drastically reduces our need for indirect exchange (the use of money). Small transactions can easily be achieved with specie and dollars need only be retained as a unit of account. "Capital" will always be something tangible and the abolition of legal tender laws will encourage the monetization of more types of capital (primarily, the most irregular of commodities).

These changes are not an effort to tame or eliminate the business cycle. Not a "utopia." But it must be acknowledged that much of the business cycle we currently experience is due to the expansion of unbacked credit. Other business cycles will persist based on demographic, social and environmentally driven changes in values (among other factors). These cycles will most often be mild, but sometimes severe. But under the system outlined above, they need never be systemically jeopardizing. Success and failure should be embraced as equal sides of a smoothly functioning economy, neither embraced nor scorned. Yet failure that does occur will be on account of poor entrepreneurial judgement, rather than as result of others' excessive risk taking and systemic collapse.

I challenge the reader to explain coherently how our current financial system serves any greater social function than what I have briefly outlined here. And I furthermore request the reader to address the morality and logic of a financial system so complex as to be incoherent to the average person, while such a simple alternative presents itself.

If anyone has any details to add, I encourage you to do so in the comments section. I was purposely vague on certain areas of my "solution" so as to elicit further discussion.


Disclaimer: The content on this site is provided as general information only and should not be taken as investment advice. All site content, including advertisements, shall not be construed as a recommendation to buy or sell any security or financial instrument, or to participate in any particular trading or investment strategy. The ideas expressed on this site are solely the opinions of the author(s) and do not necessarily represent the opinions of sponsors or firms affiliated with the author(s). The author may or may not have a position in any company or advertiser referenced above. Any action that you take as a result of information, analysis, or advertisement on this site is ultimately your responsibility. Consult your investment adviser before making any investment decisions.

Sunday, November 15, 2009

Technical Update 44.09

Major averages again failed to confirm their numerous bearish divergences with increasing selling pressure. The modest declines were not enough to instill a significant amount of fear in traders and dip buyers took advantage of the indecisiveness. Again, we turn to my list of factors that I feel will be sufficient to turn the tides. Some were achieved in the previous decline but not all. We will again have to endure higher prices and monitor continuing divergences prior to incurring more definitive sell signals.

1. Consecutive daily declines of 2.5% or more. This hasn't happened since the rally began (if so, only marginally).
2. Weaker internals than previously displayed during the rally via 10 day moving averages of a) put/call ratio b) advance/decline issues c) advance/decline volume.
3. A considerable increase in the US Dollar Index. A crossover of the 20 day EMA over the 50 day EMA is something that has not yet occurred since early April.
4. Divergence between major indices. Dow, S&P, Nasdaq, Transports, Banks. We should see significant divergence between some of these indices at a major top. There have been divergences present at various points, but they have quickly resolved themselves. Specifically, I am looking for underperformance in the transports, banks and/or the nasdaq.
5. A complete Elliott Wave '5' down on more than an intraday basis.


While it may feel like prices will inevitably rise higher, and perhaps in a final parabolic manner, it should be noted that among the divergences present at both the September and October highs, those same divergences are persisting and even more pronounced at this time. While the Dow has powered higher, only the S&P, NDX and FTSE indices have confirmed that new high in November - and each of those three have only managed it by a few measly points. For a technician that follows the Elliott Wave Principle, this is problematic. A recovery high after an initial decline (ie. a '2 wave'), cannot exceed the beginning of wave 1. This forces the technician to interpret the various indices differently until they confirm. And while there is nothing wrong with doing this, my experience is that when there are so many equally valid interpretations of the price structure it is best to focus on other technical measures until the pattern reveals itself more clearly.

So while there remains possibilities from an Elliott standpoint to continue higher, more conventional technical analysis still argues for lower prices. Significant RSI and MACD divergences as well as pathetically low volume should be warning signs to those of bullish inclination.


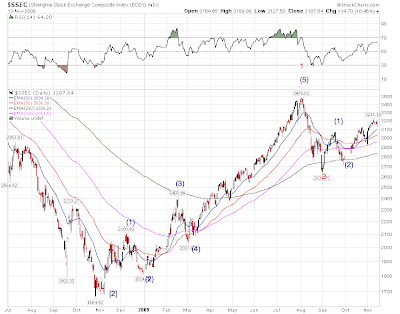
One index that does appear to be divergent with the US Dollar Carry Trade is Shanghai. As much as this differs with my overall take on China's dependence on US exports, the technical pattern is very compelling. The Shanghai market appears to have put in an impulse 5 wave pattern into the summer, and a one month correction thereafter. If this holds, the best outlook for the future is that Shanghai has put in two consecutive 1-2, 1-2 legs higher, setting up for a 3rd of a 3rd of a 3rd. In Elliott Wave terms, this is a holy grail setup and argues for MUCH higher prices. A drop below 2900 would invalidate this thesis, creating a somewhat low risk entry on the long side. Sometimes the technical patterns that do not jive with one's fundamental biases are the best trades. Mindful of this, I have taken some long side exposure in FXI as a hedge to my S&P puts.


Good luck this week!


Disclaimer: The content on this site is provided as general information only and should not be taken as investment advice. All site content, including advertisements, shall not be construed as a recommendation to buy or sell any security or financial instrument, or to participate in any particular trading or investment strategy. The ideas expressed on this site are solely the opinions of the author(s) and do not necessarily represent the opinions of sponsors or firms affiliated with the author(s). The author may or may not have a position in any company or advertiser referenced above. Any action that you take as a result of information, analysis, or advertisement on this site is ultimately your responsibility. Consult your investment adviser before making any investment decisions.
Thursday, November 12, 2009

The US Dollar Carry Trade Explained

The US Dollar Carry Trade has now broken through to mainstream consciousness. This blog, and many others of course, have been talking about this for years. Formerly disparate markets have slowly been converging for the past 10 years. The reason behind this is, quite naturally, unbacked credit expansion.

When there is no or dubious collateral behind a loan, it is only natural that the borrower will seek to speculate recklessly. The consequence of default is not the loss of anything tangible to them, only a poor credit record for a few years. And the rewards are huge if the speculation pans out. As this mentality among borrowers became entrenched, it had the effect of driving all asset classes that were typical recipients of this easy money together. Stocks, bonds, commodities, real estate, art, etc.

The source of this unbacked lending is difficult to pin down. We know that Japan was very active in pursuing credit expansionary policies in order to drive down their currency and support their export market. They lent to foreigners, and foreigners exchanged their Yen for other currencies and bought assets elsewhere. Japanese investors also took to investing abroad and gaining not only on asset appreciation, but on the depreciation in the Yen. This, known as the "Japanese Carry Trade" unwound spectacularly in 07-08. The Yen rose over 40% in 18 months, while the asset markets they were speculating in dropped by at least as much. Most who speculated in this trade likely lost 70% of their capital - all of it if they used any leverage.

Why was Japan the obvious choice for this? Because their interest rates were at near zero for years and there was no indication that they would be raised any time soon. Sound familiar?

It should, because that is the exact perception in the US. And that perception is probably correct. Benchmark rates will not be going anywhere soon. And now that the Fed has involved itself in many other markets (agency paper, money market funds, commercial paper, etc) there will be many moves to unwind these programs prior to raising interest rates. So there is no risk to this trade, right? We know better. So does everyone else. Everyone thinks, however, like the Japanese housewives playing in the forex markets, that they will be able to get out first once it begins to unwind. Simple mathematics tells us it is impossible. Like how 90% of drivers rate themselves as "above average."

In the minds of most, this doesn't matter. All that is important to today's ultra-short term minded investor is "how long will it last" and "how much money can I make?"

Often, once a trend has become common public knowledge, it is already over. This is the logic behind the magazine cover contrary indicator. Sometimes, however, the trend needs to become manic prior to exhaustion. In my opinion, we have already reached this point. Most others see the potential for it to last longer and run deeper. I suppose they could be right. Thinking back to early 2007, it looked fairly apparent that the Shanghai market was going to put in a top and was getting ahead of itself. It went on to double itself from those levels. It then lost 73% - halving those initial 2007 levels. Bubble callers were vindicated in the end but likely lost in three ways: shorting too early, missing a huge run-up, and being too shy at the real top.

There is a fine line between early and wrong. It is the same line between profit and loss. The flipside is that markets have an uncanny way of convincing you you're early, right before they turn around. I call this the path of maximum frustration.

The US Dollar Carry Trade is a bubble - just like all the others. It will unravel. I'm doing my best to hedge in the case of being too early in order to ensure I can participate in the unraveling process, which promises to be a doozy.

I look forward to the day when investing is again more about increasing productivity, wealth, prosperity, and less a game of Jenga. But when life gives you oranges...


Disclaimer: The content on this site is provided as general information only and should not be taken as investment advice. All site content, including advertisements, shall not be construed as a recommendation to buy or sell any security or financial instrument, or to participate in any particular trading or investment strategy. The ideas expressed on this site are solely the opinions of the author(s) and do not necessarily represent the opinions of sponsors or firms affiliated with the author(s). The author may or may not have a position in any company or advertiser referenced above. Any action that you take as a result of information, analysis, or advertisement on this site is ultimately your responsibility. Consult your investment adviser before making any investment decisions.

Sunday, November 8, 2009

Technical Update 43.09

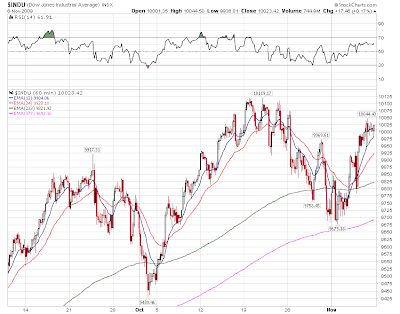
The S&P 500 posted gains on all 5 days this week to retrace nearly 61.8% of the prior decline. The advance was achieved on extremely low volume, and with decreasing participation. The Russell 2000 managed to retrace only 43% of its decline, while the larger cap Dow 30 made up 83% of its previous fall. The generals are charging up the hill while the troops lag behind, paralyzed with fear.

Tops are a process, while bottoms are an event. And this topping process appears to be no different. Especially bearish would be for certain indices (like the Dow) to make a marginal new high early next week, while the others fail to confirm. The bearish divergences noted in these pages two weeks ago would become even more pronounced. But that is not necessary. The oversold conditions have been worked off by both time and price and should not be hindered from continuing their descent from fantasy land. New highs in all the indices would indeed be frustrating (recall August to October 2007). But the technicals all point in the same direction, and evidence mounts almost daily that market action is conducive to lower prices, not higher.

Below are hourly charts of the Dow Industrials and Russell 2000 respectively. Notice the extreme divergence.


As mentioned earlier, the internals of the week's advance were extremely weak. Below is the up/down volume ratio. The blue line is a 10 day moving average of the ratio. Lower readings above zero indicate weaker participation on rallies.


The commodity complex has been weakening despite Gold's continued strength where a non-confirmation in silver may prove difficult to surmount. Below see the CRB index and Silver.


That's all for now.

Disclaimer: The content on this site is provided as general information only and should not be taken as investment advice. All site content, including advertisements, shall not be construed as a recommendation to buy or sell any security or financial instrument, or to participate in any particular trading or investment strategy. The ideas expressed on this site are solely the opinions of the author(s) and do not necessarily represent the opinions of sponsors or firms affiliated with the author(s). The author may or may not have a position in any company or advertiser referenced above. Any action that you take as a result of information, analysis, or advertisement on this site is ultimately your responsibility. Consult your investment adviser before making any investment decisions.

Thursday, November 5, 2009

Crisis in Colombia Brings Opportunity

I often talk about generational cycles having major impacts over long-term trajectories in markets, and societies in general. To most, it sounds like a very fatalistic way of looking at things: no matter how hard we try, we're destined to repeat our failures. This was proven true again in 2008 as markets tumbled after debt levels rose uncontrollably for decades, securities fraud was rampant and corrupt politicians and regulators did their best to cover up these problems - and in many cases perpetuated them themselves. It was like a carbon copy of what led to the Great Depression.

But generational cycles are not always bad. Like all cycles of their sort, they have expansionary and contractionary periods - very much like the seasons. So while all signs point to much of the western world (more accurately, any nation that participated in WWII) being in the thick of a generational crisis era, there are other parts of the world, that are in different points in their own respective cycles. This may prove to be important for investors, looking for growth around the world as their own asset markets experience much needed corrections.

Many South American nations fit this description. Specifically, Argentina, Brazil, Chile, Colombia, Peru and Uruguay.

Whenever I am in conversation with other investment managers and economists, bringing up these countries as ideal areas for investment results in scrunched noses and shaking heads. After all, they have recent histories of hyperinflation, corruption, drug lords and brutal dictatorships.

"Precisely," I answer.

The recent histories of these nations are awful. Just 20 years ago, nearly all were controlled by corrupt dictators. Senseless killing was a way of life. Political opponents would simply disappear or fight guerilla wars with government armies. Socialist price fixing schemes left food and medical care in short supply.

In 1985, the military dictatorship was overthrown in Brazil. In 1988, democracy was restored in Chile. Pablo Escobar was killed in 1993 and the drug cartels that terrorized Colombia were nearly completely destroyed a few short years after. Argentina's "Dirty War" ended in the early 80's and democracy was restored. Unfortunately, continually poor economic policy has led to recurrent crises. Regardless, the standard of living has continually risen since 1990.

The recent memory of these issues provides the perception that South American countries were always this way and always will be. But this is not the case. Argentina and Chile in the early part of the 20th century were some of the wealthiest and most advanced nations in the world. European wars led to an influx of educated immigrants that embraced the resource rich lands and prosperity abounded. "He's as rich as an Argentine" was a popular expression.

After spending 5 months during '06-'07, primarily in Chile, I feel like I can offer some insight into how they have definitely changed their ways. The Chilean people are incredibly well educated. And they are consistently ranked as having the most economic freedom of any country in the developing world. One particular observation stuck: the Chilean's commitment to higher education. Riding on the subway in Santiago was the best way to experience this. In much of North America, the banner ads in the station and train cars are full of chewing gum, television shows, deoderant and other useless gimmicks. In Santiago, most are occupied by post-secondary schools. And if one were to ride the subway in the evening, many of the commuters are not going home from work, they're on their way to night classes. Chileans are intently focused on the future. And when one talks about the future there, one talks about 10 years, not 10 months.

The reason behind this can easily be found in demographics. In conjunction with the end of major crises and the beginning of new freedoms, people tend to be fairly jubilant, resulting in baby booms. And in the late 80's/early 90's most of these nations I've mentioned experienced enormous baby booms. Today, they have some of the youngest populations in the developing world with - according to the CIA world factbook - between 23-29% of their populations 14 years old and younger. China, in contrast, has only 19% (and enormous issues with male/female disparity). Germany and Japan sit around 13.5%. Other nations with higher ratios of young populations are typically marred by high infant mortality rates, famine and/or HIV.

With such a burgeoning young population and the recent memory of brutal dictatorships still ingrained in the memories of their parents, these societies are naturally disinclined to extremism, protectionism, violence and corruption. The best analogy for this is America in the decades following WWII. The generational High and generational Awakening eras are typically favourable eras for investment due to the natural increasing demand from younger generations. They are also characterized by something else: utter paranoia of the bad times returning. Again, think of America in the 50's and early 60's. Nuclear war with the Soviets was thought of as an inevitability. And every recession was met with fears of a depressionary repeat of the 30's. Each bout of this pessimism was met with large stock market declines, only to be followed with breathtaking rallies, innovation booms and a rising standards of living.

With that in mind, I came across an article yesterday about Colombia that typifies this mentality. The content of the article is not all that important (the Colombians are having continuous issues with neighbouring Venezuela and their lunatic dictator Hugo Chavez). But the fact that so many are fearful of this escalating into a broader conflict is typical of a generational Awakening era. These are the types of events that dampen positive social mood, creating huge selloffs in asset markets and allowing for low-risk entries into burgeoning markets.

South American stock markets have indeed come under the same allure as other emerging markets from the US Dollar carry trade. And they will likely succumb to similar panics when this inevitably unwinds. But the favourable demographic positions of many of these nations will have me buying dips in anticipation of continued future prosperity, stability and an eventual leadership role in world affairs.

South America is often lumped in with other emerging markets as part of the same US consumer dependent globalization trade. I have reason to believe their growth is based on firmer foundations.

Disclaimer: The content on this site is provided as general information only and should not be taken as investment advice. All site content, including advertisements, shall not be construed as a recommendation to buy or sell any security or financial instrument, or to participate in any particular trading or investment strategy. The ideas expressed on this site are solely the opinions of the author(s) and do not necessarily represent the opinions of sponsors or firms affiliated with the author(s). The author may or may not have a position in any company or advertiser referenced above. Any action that you take as a result of information, analysis, or advertisement on this site is ultimately your responsibility. Consult your investment adviser before making any investment decisions.

Sunday, November 1, 2009

Technical Update 42.09

Today will be a more in-depth post covering the equity and currency markets.

The largest one week decline since early May and the breaking of numerous important trendlines has shifted the odds in favour of the bearish camp. While near term technicals provide good cause for an early week bounce, last week's change in character suggest that this should be used to lighten long positions as opposed to the previous norm of buying dips. The list of indicators I have been using to confirm this move is not yet complete, however. There remains a few holdouts. Presumably, a significant push below the early October lows (1019) or the September lows (991) would satisfy these requirements.

First, the list of indicators I have been tracking, posted as it has been for the past few weeks:

1. Consecutive daily declines of 2.5% or more. This hasn't happened since the rally began (if so, only marginally).
2. Weaker internals than previously displayed during the rally via 10 day moving averages of a) put/call ratio b) advance/decline issues c) advance/decline volume.
3. A considerable increase in the US Dollar Index. A crossover of the 20 day EMA over the 50 day EMA is something that has not yet occurred since early April.
4. Divergence between major indices. Dow, S&P, Nasdaq, Transports, Banks. We should see significant divergence between some of these indices at a major top. There have been divergences present at various points, but they have quickly resolved themselves. Specifically, I am looking for underperformance in the transports, banks and/or the nasdaq.
5. A complete Elliott Wave '5' down on more than an intraday basis.

Below is a weekly chart of the S&P 500. It has breached its trendline from the March lows significantly. However, it is common practice for price to test the underside of that line once broken. Notice the negative divergences on the RSI. Also note the imminent MACD crossover.


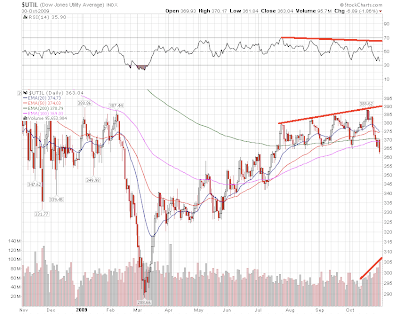
Weakness in the secondary indices is one of the signals I have been watching for at a market top. We had a failure in many of these indices to surpass their September highs, even as broader indices did so. And now we have these same indices underperforming on the way down. This is textbook relative weakness. And it is exactly what one would expect to see at a top. In addition, we have RSI divergences, MACD crossovers, trendline breaks, increasing volume and important moving averages being broken over the past week. I don't know how much more clear-cut this could be. In order of appearance below we have Dow Transports, Dow Utilities, Russell 2000 and the Semiconductors Index.


Please do not read into this that a crash is imminent. As we have seen countless times, such divergences can persist for longer than most expect. Throughout the 2007 topping process, we had such persistent divergences in many indices even as the broader indices continued higher. Each push higher resulted in even stronger divergences while slowly convincing people that they were not important. As soon as attention dissipated, only then did they manifest into significant declines.

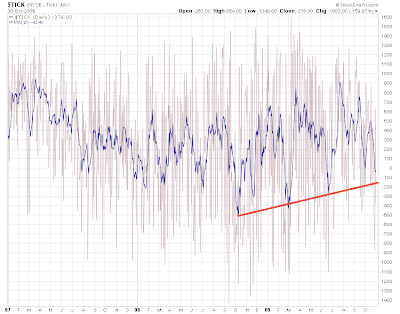
As for market internals, we had been experiencing progressively weaker market breadth and advancing volume as the indices marched higher from their July lows. As expected, many of these indicators are now displaying their weakest readings since the March lows. Below see the put/call ratio, advancing/declining issues, advancing/declining volume and daily closing TICK (the lone holdout).


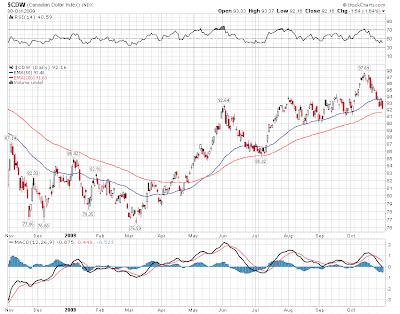
The confirmations I have been expecting in the currency markets have been mixed. The USD strengthened by over a percent this week and trendlines were only moderately violated. Continued weakness in the Canadian Dollar and the Euro are the keys to confirming a bottom in the USD. Support for these currencies is wearing thin, however, and failing a swift turnaround, the stage will be set for an unwinding of the "US Dollar carry trade" that would eventually send it significantly past its March high.

The Canadian Dollar specifically appears to be at a very important crossroads. It has experienced some of the most speculative flows during the so-called 'recovery.' As this hot money unwinds in the stock and commodity markets, the Loonie could get hammered significantly. I am using the Loonie as a barometer for risk appetites and watching closely.


The Euro, as I have repeatedly mentioned before, does not have any better intrinsic value than the US Dollar. Yet for some reason Dollar bears have latched on to the currency as some sort of safety hedge. In my opinion, this is quite ignorant to the enormous problems present in the European banking system, their exposure to risky loans in Eastern Europe, and the political issues between the more stable Northern European government balance sheets and those in Ireland as well as the PIGS (Portugal, Italy, Greece, Spain) all of whom are running massive deficits in violation of the Maastricht Treaty.

Technically, it has only marginally broken its trendline, a situation that upon reversal could become a "pinocchio" buy signal. Again, increased attention is warranted.


Good luck next week!

Disclaimer: The content on this site is provided as general information only and should not be taken as investment advice. All site content, including advertisements, shall not be construed as a recommendation to buy or sell any security or financial instrument, or to participate in any particular trading or investment strategy. The ideas expressed on this site are solely the opinions of the author(s) and do not necessarily represent the opinions of sponsors or firms affiliated with the author(s). The author may or may not have a position in any company or advertiser referenced above. Any action that you take as a result of information, analysis, or advertisement on this site is ultimately your responsibility. Consult your investment adviser before making any investment decisions.

View My Stats